Last updated:
BIM Analytics Data Lineage: Make Every Metric Traceable
TL;DR
BIM analytics data lineage records where a metric came from, what grain it uses, how it changed, who owns it, when it refreshed, and where it is consumed. It turns a dashboard value from an isolated number into a verifiable chain that BIM, data, product, and business teams can inspect together.
What is BIM analytics data lineage?
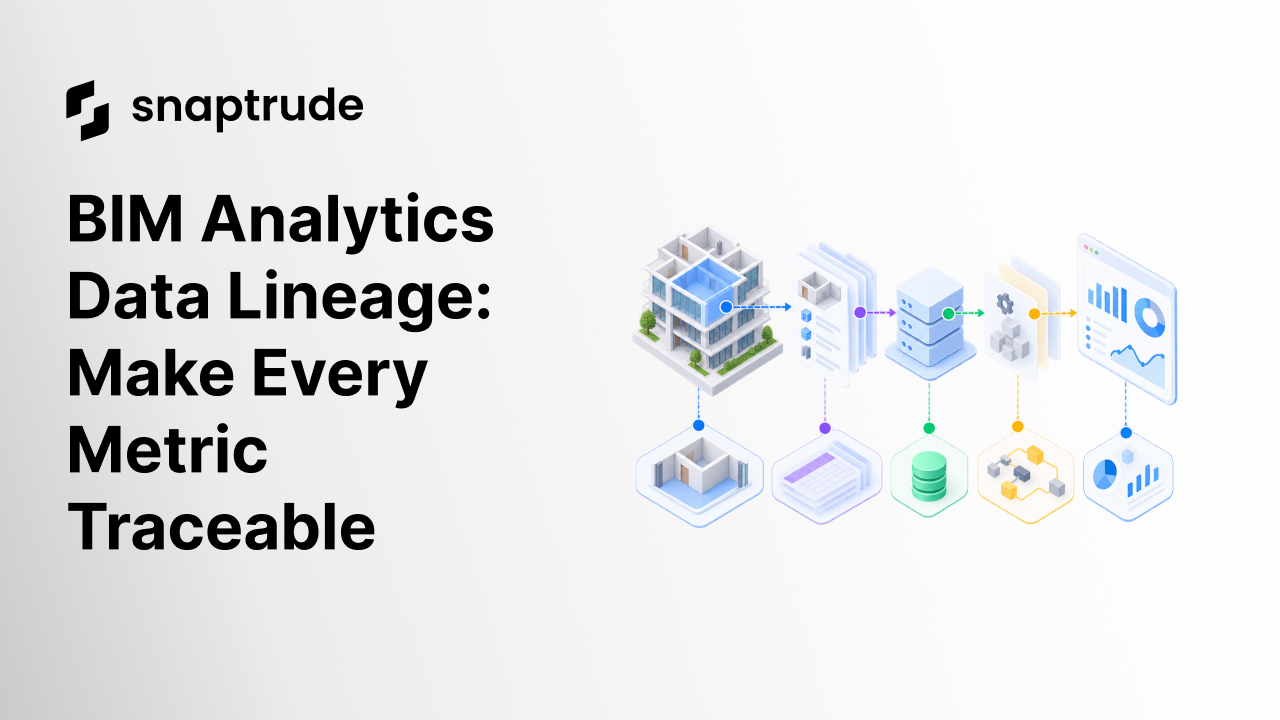
BIM analytics data lineage is the traceable path from a BIM object, file, event, or business record to a calculated metric and the decisions that consume it. A complete path names the source system, entity, grain, extraction time, transformations, joins, exclusions, owner, refresh policy, destination, and intended use.
Imagine a dashboard reporting “active projects.” The label looks simple. The underlying question is not. Does a project become active when it is created, opened, edited, shared, or exported? Are test projects excluded? Is the count taken per day, week, account, workspace, or project? Can one project appear in two source systems? How late can an event arrive before the report changes?
Without lineage, a team debates the visible number. With lineage, it inspects a defined chain.
The W3C PROV ontology provides a general vocabulary for this chain. It distinguishes entities, activities, and agents, then relates them through concepts such as use, generation, derivation, and association. A BIM analytics implementation does not need to expose PROV terms in every dashboard. It should preserve the same basic questions: what existed, what process acted on it, who or what was responsible, and what was produced. (W3C PROV-O)
.jpeg)
Why does BIM analytics data lineage matter?
BIM analytics data lineage matters because BIM and AEC reporting often crosses systems with different purposes. A model stores building objects. A collaboration platform stores people and actions. A project system stores accounts and status. A warehouse reshapes those records. A business-intelligence tool aggregates them again. Every boundary can change meaning.
Five failures appear repeatedly:
• Grain mismatch: project-level records are joined to object-level events and counted several times.
• Identity drift: one project, account, room, or object has different identifiers across systems.
• Silent transformation: a filter, deduplication, or classification changes without a versioned definition.
• Freshness ambiguity: the dashboard timestamp is current, but an upstream extract is stale.
• Ownership gaps: everyone consumes the metric, but nobody owns its definition and source health.
NIST's Data Governance and Management Profile concept paper notes that data from multiple sources and uncertainty about provenance can amplify quality challenges. The practical lesson is that more data does not automatically produce more confidence. A report earns confidence when teams can inspect its evidence path and limitations. (NIST Data Governance and Management Profile concept paper)
Read why BIM is valuable when geometry and information remain connected.
Pick one metric used in a weekly decision and trace it back to its first authoritative record before adding another chart.
What should a BIM metric contract contain?
A BIM metric contract should contain enough information for an independent reviewer to reproduce the value and judge whether it is fit for a particular decision. A formula alone is not enough.
The decision purpose belongs near the top. A directional product signal can tolerate different latency and precision than a contractual area report. The same label should not serve both without declaring the difference.
Do not hide exclusions inside code. If internal workspaces, automated actions, imports, archived projects, or incomplete events are excluded, state that in the contract. A defensible metric is not merely reproducible. Its boundaries are reviewable.
How do you map BIM analytics data lineage?
Map BIM analytics data lineage from the decision backward, then validate the path forward with a known record. This avoids documenting every warehouse table while missing the transformation that actually affects the reported answer.
1. Start with the decision and visible metric
Record the dashboard, chart, audience, decision, owner, unit, filters, and display timestamp. Capture the exact definition currently presented, not the one people assume it uses.
2. Identify the final dataset and transformation
Find the table, view, query, or semantic model that produces the visible value. Record grouping, deduplication, joins, time windows, and exclusions. If logic appears in both the warehouse and dashboard, include both layers.
3. Trace every input to an authoritative source
For each field, identify the system responsible for creating and correcting it. A warehouse may be the delivery source without being the authority. Distinguish modeled area from imported target area, user-entered classification, calculated quantity, and event-derived behavior.
4. Record identity and grain changes
Mark each place where the record changes grain. Object events may roll up to a model, model to project, project to workspace, and workspace to account. Record how identities are matched and what happens when a key is missing or reassigned.
5. Attach refresh and quality evidence
Include extract time, event-time coverage, expected delay, row counts, duplicate tests, null checks, and reconciliation results. A pipeline completion timestamp does not prove that its input was complete.
6. Validate with one known record
Select a project or object whose source state can be inspected. Follow it forward through every transformation and confirm whether it should contribute to the final metric. Then select one excluded record and prove that it remains excluded for the documented reason.
OpenLineage structures lineage around jobs, runs, and datasets. Its facets extend those core objects with metadata, and its column-lineage facet can record how output fields derive from input fields. This pattern is especially useful for analytics pipelines because operational events and documentation travel with the same lineage graph. (OpenLineage Facets)
How do you diagnose a broken BIM dashboard metric?
Diagnose a broken BIM dashboard metric by classifying the symptom before rewriting the query. A sudden change can come from reality, collection, identity, transformation, timing, or presentation.
Begin with a comparison at the metric's declared grain. Check record counts and unique keys before checking totals. Then review recent definition, schema, mapping, and pipeline changes. Reconcile a small sample to the source. If the issue cannot be resolved, label the metric unavailable or provisional rather than presenting an unexplained value as current.
A good incident record links the affected metric version, first bad period, source evidence, transformation change, correction, restated periods, and downstream consumers. This extends lineage from documentation into operational control.
Explore how connected collaboration changes the project information loop.
How should lineage handle BIM object data?
Lineage should distinguish object identity from object properties and calculated observations. A stable object identifier answers which element the record describes. Properties answer its current semantic state. Quantities answer what was measured under a stated rule. Events answer what happened at a time. These are related but not interchangeable.
For an area metric, record whether the value came from current geometry, a program target, an imported schedule, or a factor-derived allowance. For a collaboration metric, distinguish a user action from a system action and a project edit from a mere open. For exchange quality, retain both source and destination identity plus the mapping or validation result.
When a model is revised, decide whether analytics need the latest state, an immutable snapshot, or both. Operational dashboards often need the latest state. Audits and comparisons need the version that was true at the decision date. Store the effective time and extraction time so a later reviewer can tell the difference.
How does Snaptrude support traceable BIM information?
Snaptrude connects Program, Design, BIM, and Present modes in a browser-based environment. Program Mode supports program data, areas, adjacencies, and a direct connection to 3D design. BIM Mode supports building elements, quantities, schedules, drawings, and IFC export. Real-time collaboration and version history support shared review and recovery.
Those connected capabilities can reduce manual handoffs between design information and model outputs. They do not define an organization's analytics metrics. Teams still need explicit source ownership, grain, identity, transformation, refresh, and approval rules when data leaves the authoring workflow and enters an operational report.
See how browser-based BIM supports a connected collaboration environment.
References
PROV-O: The PROV Ontology: W3C Recommendation defining entities, activities, agents, and provenance relationships such as use, generation, derivation, and association.
OpenLineage Facets: OpenLineage documentation describing extensible metadata for jobs, runs, and datasets.
OpenLineage Column Lineage Dataset Facet: OpenLineage specification for recording input-field dependencies behind output fields.
Data Governance and Management Profile concept paper: NIST discussion of data governance, provenance, multiple-source complexity, and data-quality risks.
Frequently Asked Questions About BIM Analytics Data Lineage
Q: What is BIM analytics data lineage?
A: BIM analytics data lineage is the recorded path from a model object, event, file, or business record to a transformed metric and its consumers. It identifies source authority, grain, identity mapping, joins, calculations, exclusions, time rules, refresh, ownership, and version. The path lets an independent reviewer reproduce the value and decide whether it is suitable for a specific decision.
Q: Is a data dictionary enough for BIM analytics?
A: A data dictionary explains fields and values, but it rarely shows the complete path into a report. Lineage adds sources, transformations, jobs, timing, ownership, and destinations. Use both. The dictionary states what a project identifier or area field means. Lineage shows where it originated, how it was joined or aggregated, and which dashboards and decisions depend on it.
Q: What is the most common grain error in BIM reporting?
A: A common grain error occurs when many object-level or event-level rows join to one project record and the report counts the project once per matching row. Declare the intended observation unit before joining. Test uniqueness at every stage, inspect join cardinality, and aggregate only after the identity and inclusion rules are explicit. A plausible total can still contain concealed duplication.
Q: How should a dashboard show stale BIM data?
A: Show the latest covered source period, upstream extraction time, and expected refresh interval, not only the dashboard render time. If the source exceeds its allowed delay, mark the metric stale or unavailable. Do not silently carry the previous value forward as current. The owner should also know which downstream charts and decisions inherit the same freshness problem.
Q: Can lineage help when a metric definition changes?
A: Yes. Version the metric contract, record its effective date, preserve the prior transformation, and identify whether historical periods were restated. Downstream dashboards should reference a definition version. This lets reviewers distinguish a real behavioral change from a changed calculation. If values are restated, retain the old result or a reconciliation so earlier decisions remain understandable.
Q: How does Snaptrude relate to BIM analytics data lineage?
A: Snaptrude connects program information, model geometry, quantities, schedules, drawings, collaboration, and IFC export. These connected sources can support traceable downstream workflows, but an organization must still define analytics ownership and transformations. When exporting or reporting, preserve stable identities, measurement meaning, source revision, and intended grain so the resulting metrics remain verifiable outside the design environment.
Choose one decision-critical BIM metric, write its contract, trace one included and one excluded record, and do not publish it until both paths reconcile.