December 19, 2023
V2.2.0
Improved Areas
"One of the primary objectives of this release is to integrate areas with realistic design workflows. We have introduced a new UI that is responsive and precise to aid architects make informed decisions in their designing processes, thereby increasing productivity."
-Spoorthi Narayan, Product Specialist
What’s New
- Area statements have been rebuilt with a bunch of improvements and a new informative UI to make them more accurate and visually comprehensible.
- In the 2D view, areas of masses drawn are now displayed on the canvas when you complete drawing a mass.
- A similar UI/UX follows when you draw a Floor using the Draw Tab.
- Footprint areas for masses have also been introduced in the Object Properties panel. This is defined by the base area of a mass.
Live On-canvas Area display and updates
Areas are now displayed live on masses while you’re drawing new spaces, splitting existing spaces or editing/extending spaces, making it easier to take informed design decisions on the fly.
- Hovering on a mass using the ‘Select’ tool or ‘Draw’ tool displays the areas along with label name.
- Area statements are updated in real-time as you make edits in the model, as per the object types.
- Edits made to shared edges or vertices of masses result in live updates to the areas of the multiple masses simultaneously.
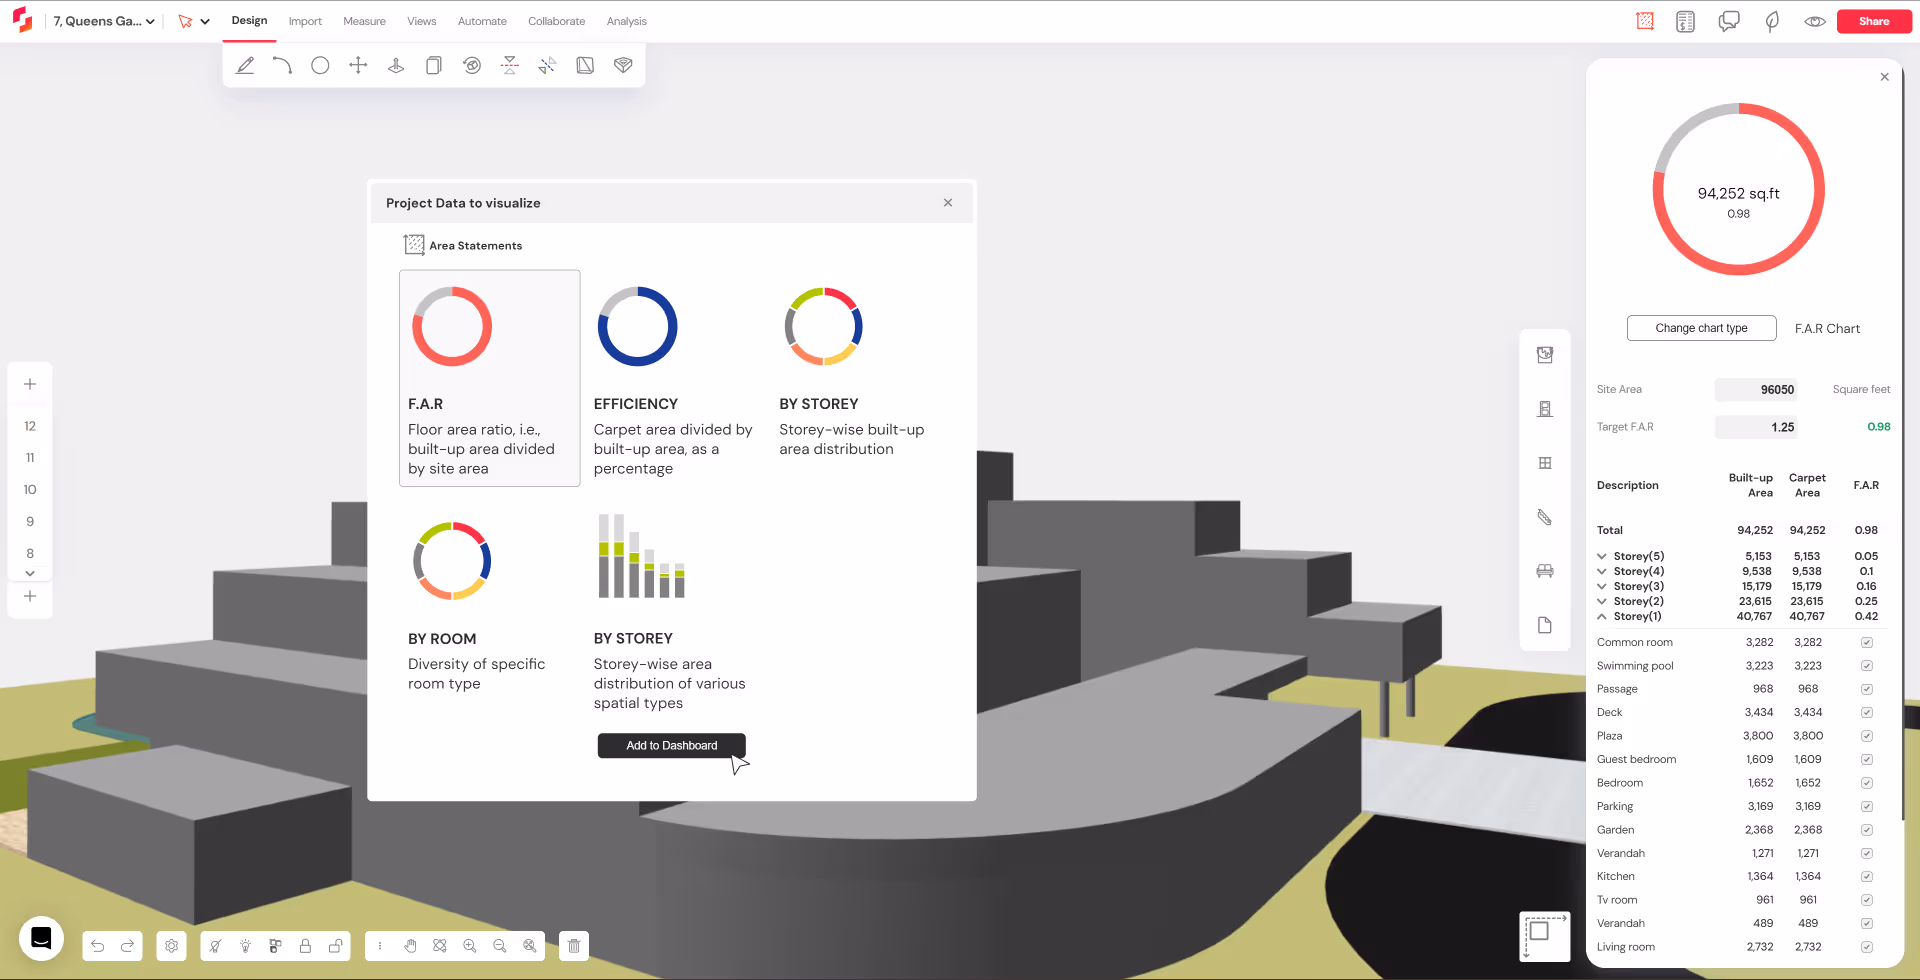
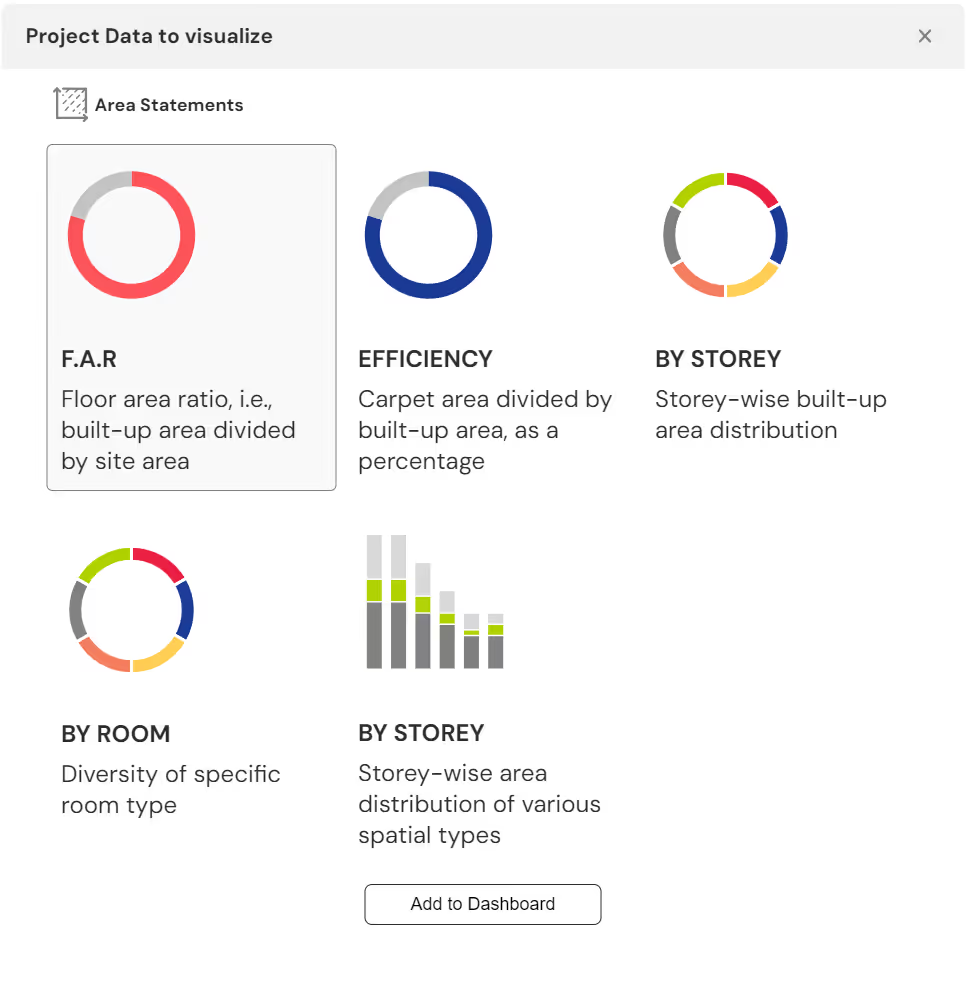
Visualize detailed areas using charts
Architects need to constantly iterate with project area requirements without compromising on the design fidelity. The new representational area charts act as visual guides to help you keep a tab on project areas through the lenses of FAR, efficiency, storey distribution and room types.
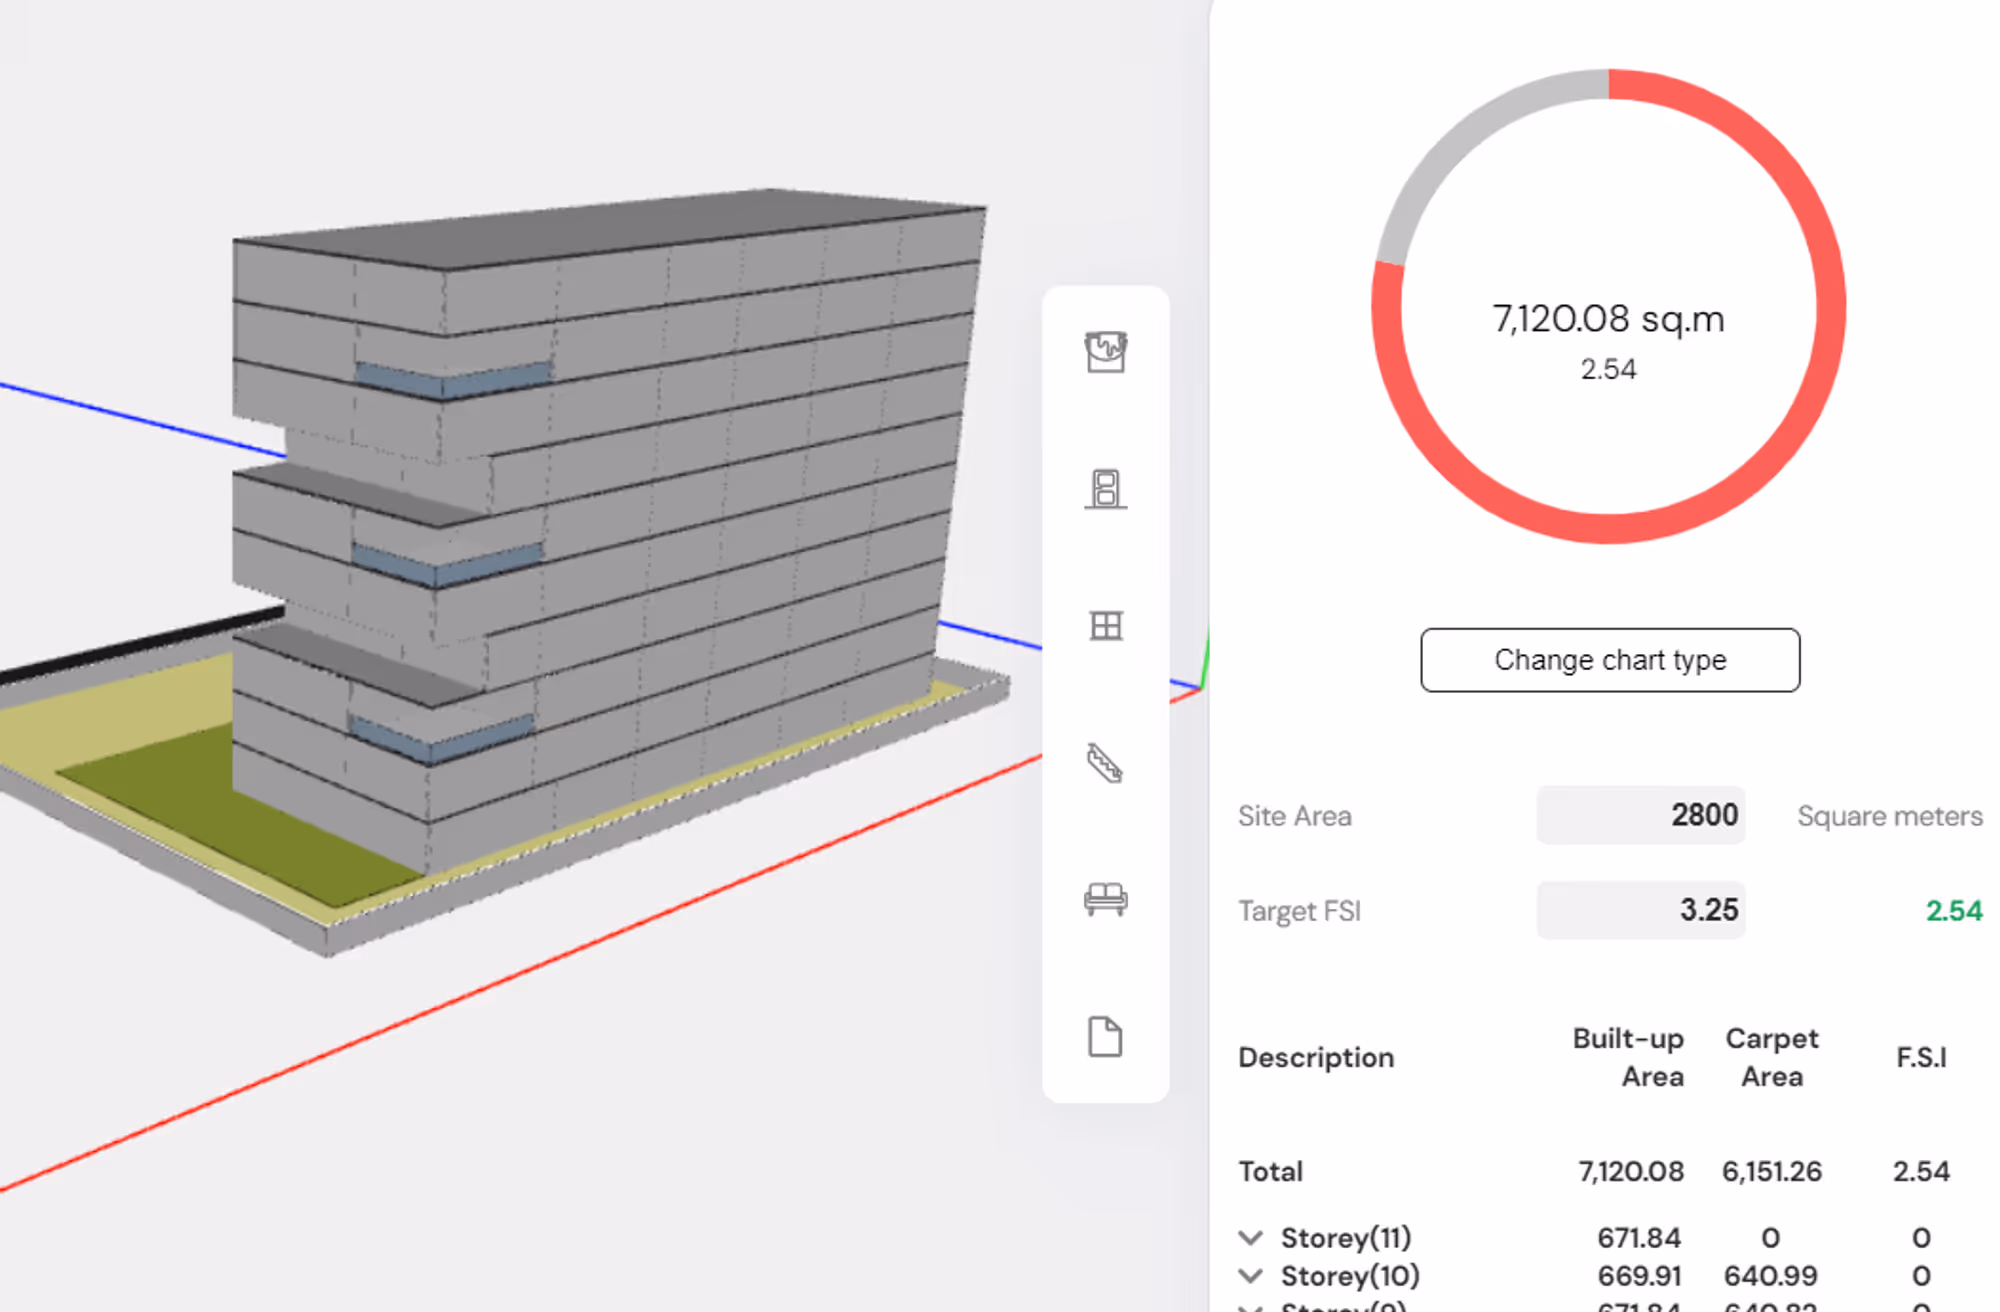
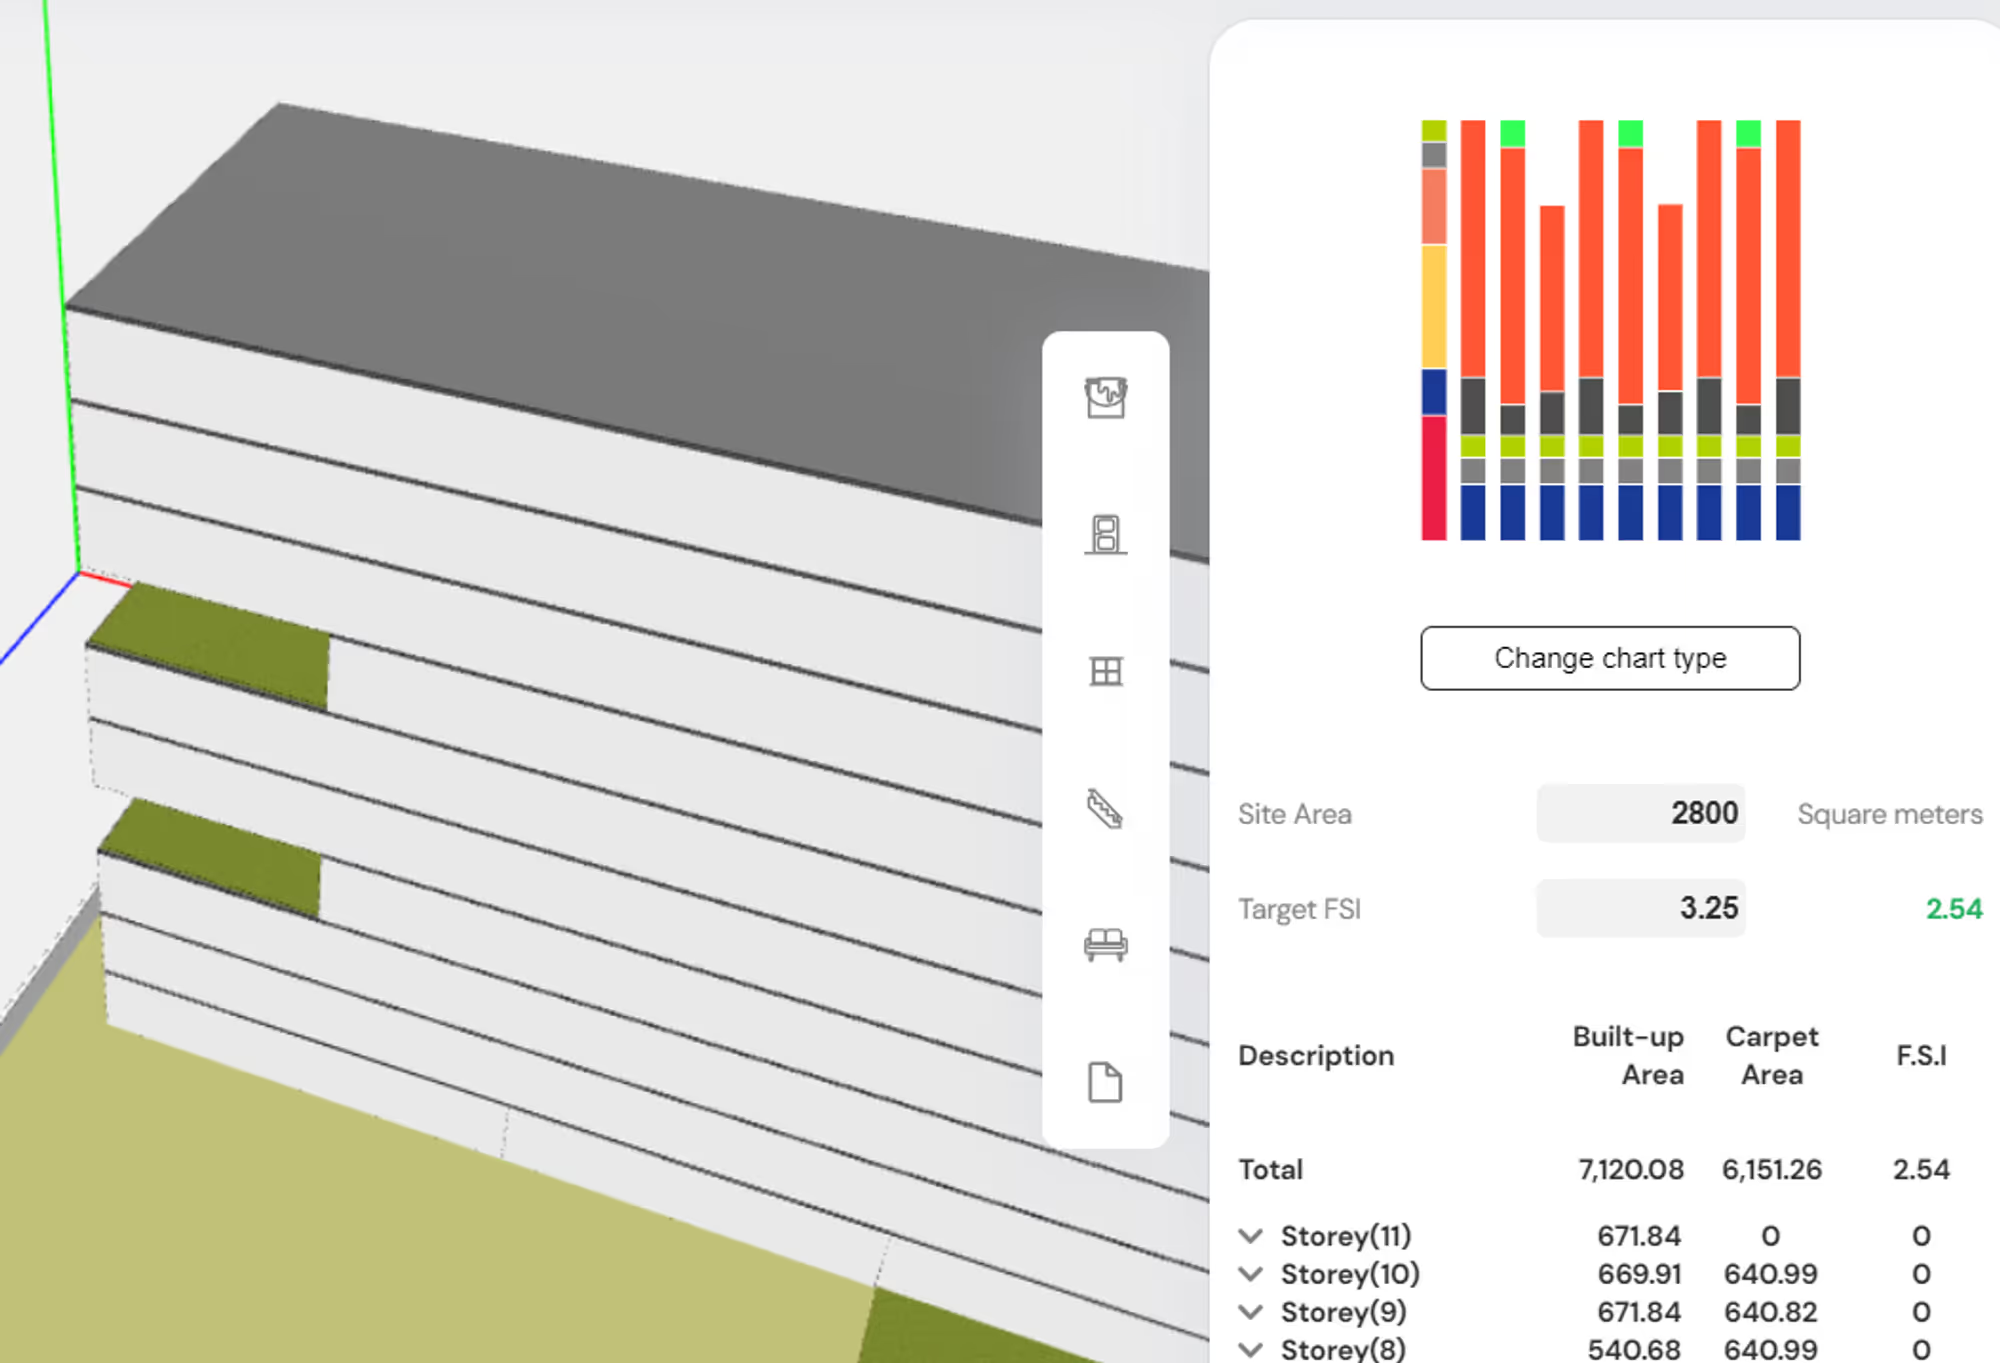
FAR chart
- The Floor Area Ratio (FAR) chart denotes the FAR consumed in the project as against the permissible/available FAR on the land.
- While you may define the Site Area either by a manual input in the text field or by drawing a mass and labeling it as site, the Target FSI for the project needs to be entered manually in the text field.
Efficiency chart
- The Efficiency chart denotes the ratio of the total carpet area (net internal area) to the total built-up area (gross external area) expressed as a percentage.
- This helps you design efficiently by maximizing the carpet area while minimizing wastages.
- All Space object type masses and individually drawn BIM floors account for carpet areas.

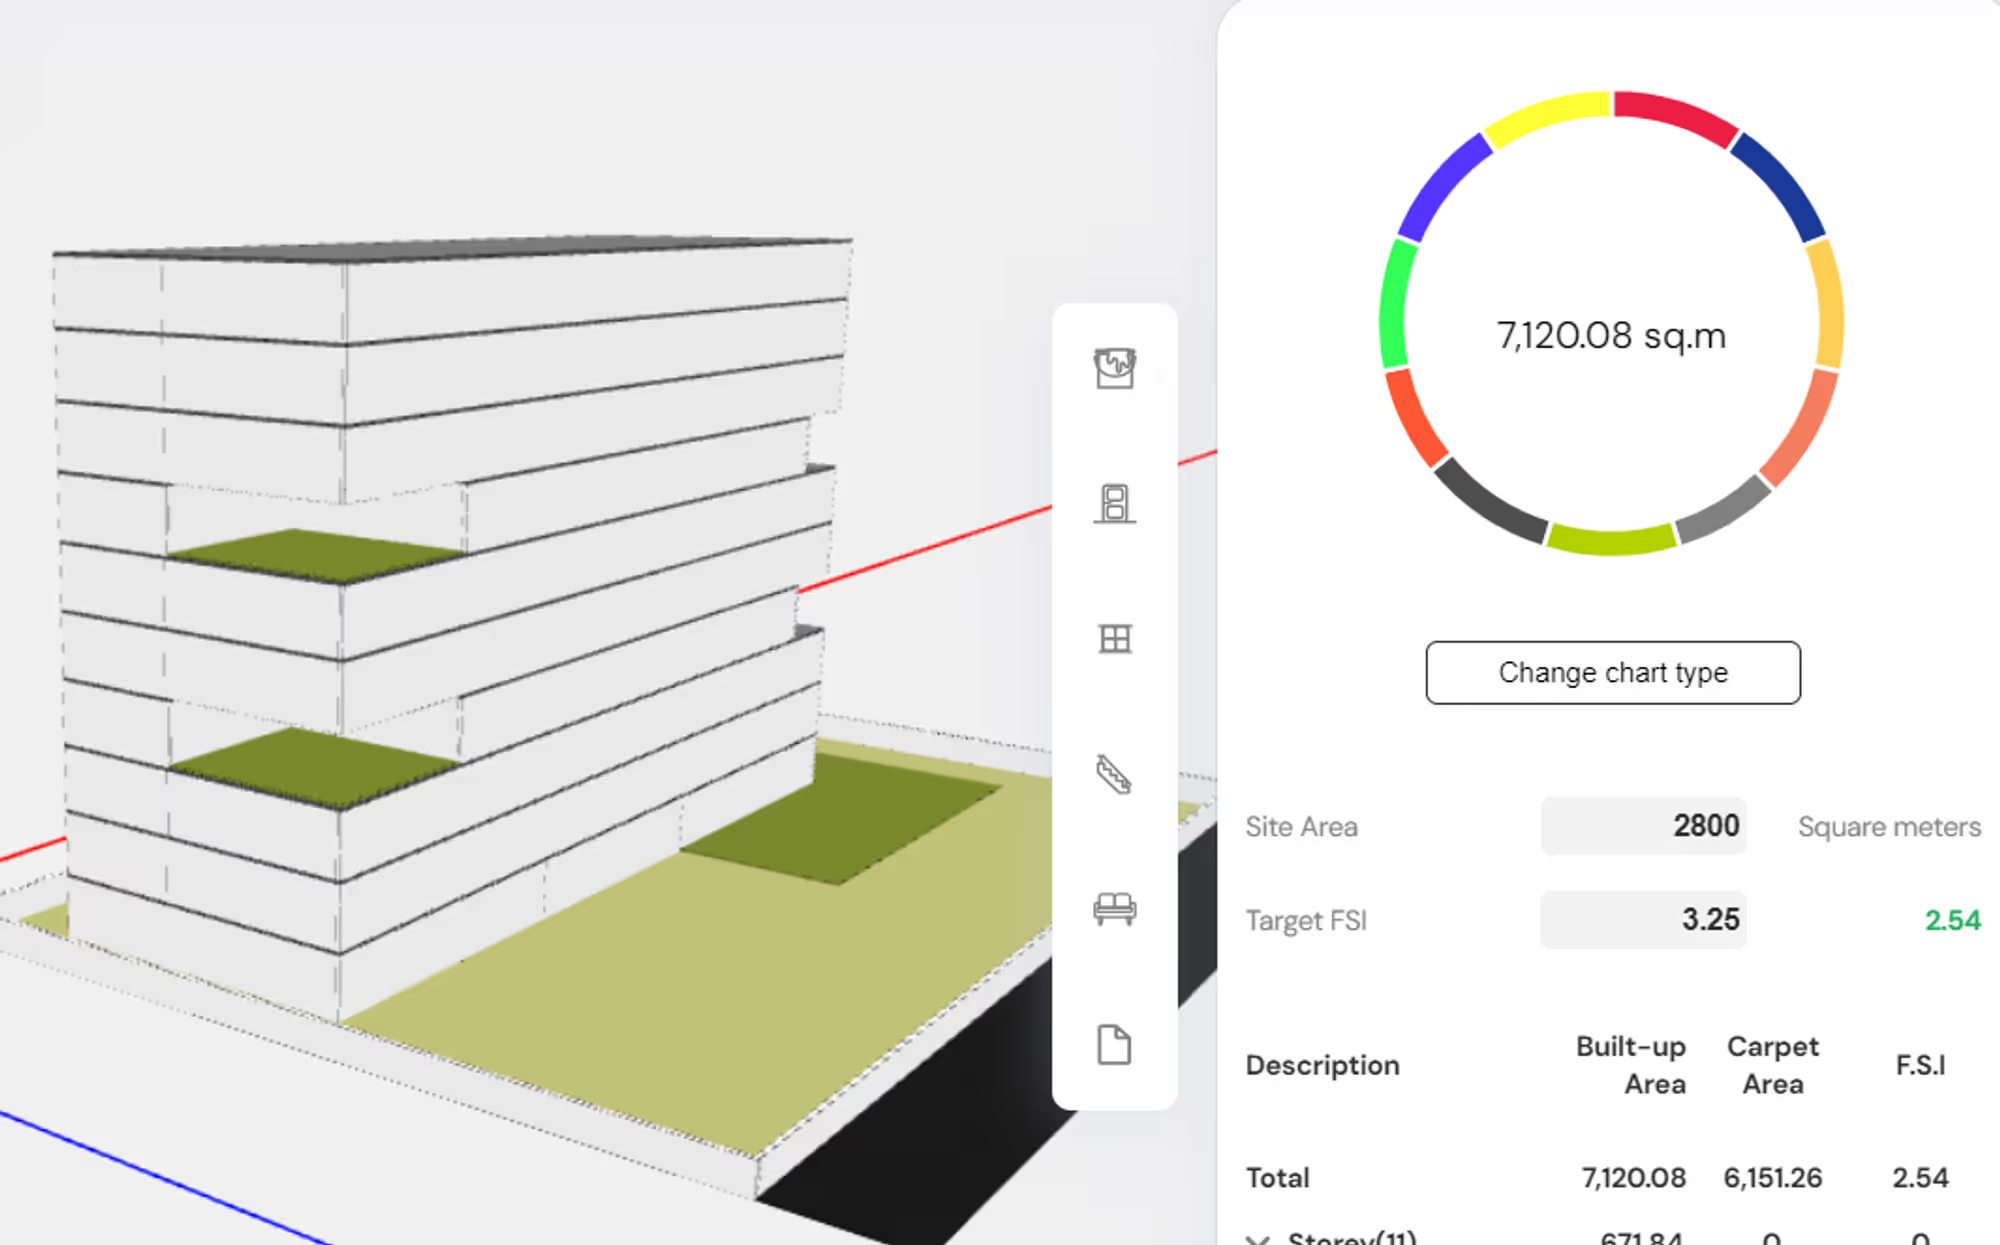
By Storey donut chart
- The By Storey chart visually represents each storey’s built up area in the form of a donut chart.
- All Space object type masses and individually drawn BIM slabs account for built up areas.
By Room chart
- The By Room chart groups similarly labeled room types and displays them in a donut chart.
- All rooms created by Space object type masses and individually drawn floors that count as carpet areas get categorized in this chart.
- Eg. the chart below is that of a commercial office building, the red portion being the main office space. By referring to this chart, one can gauge if the programmatic area distribution achieved in the project is proportionate to the required design brief.

By Storey bar graph
- The By Storey chart depicts distribution of room areas or spatial room types across storeys as a stacked bar graph.
- Every storey is shown as an individual bar and the segments inside the bar represent the different room types.
- Similar to the previous chart, all space object mass type and floors account for the spatial room type distribution across storeys.
What We’ve Improved
The new updates ensure precision, accuracy and consistency of data by making numerical calculations more reliable.
- When the model is in the massing stage, both the BUA and carpet area will be the same and reflect the footprint area of masses.
- After using the ‘Create Building’ tool, or if the model has individual BIM object types, the slab areas will be computed in the BUA and the floor areas will be accounted for in the carpet areas.
- The project areas are organized by storeys and rooms in the Area dashboard. Each storey can be expanded to view the individual room areas, and their contribution to the project FSI.
- The check boxes give the user an option to include/exclude rooms while computing the achieved FSI. Un-ticking the checkboxes will exclude those rooms from the FSI calculations.