Last updated:
Your Program Has the Data. Now You Can See It.
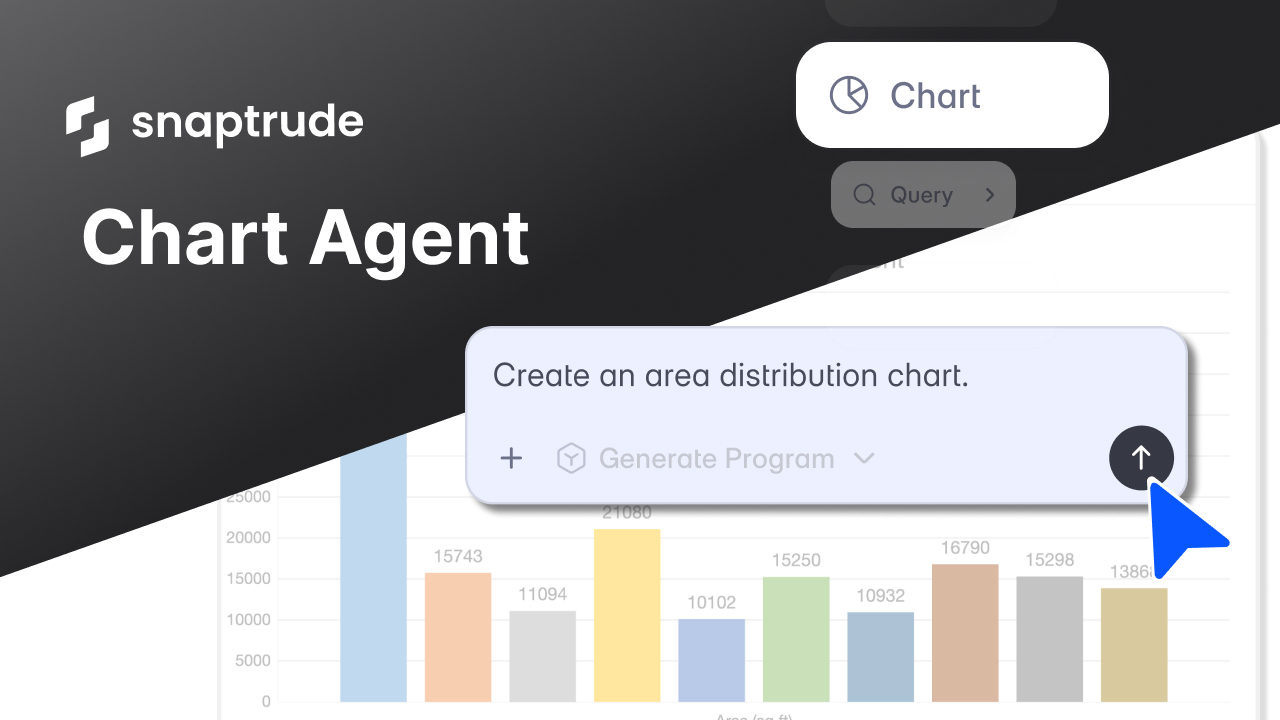
The Chart Agent in Snaptrude generates charts and visualizations directly from your architectural program data. You type a prompt describing what you want to see, and the agent reads your program, prepares the data, and creates an editable chart in a new sheet, all within Program Mode.
Why is program data so hard to see?
A building program is one of the most data-rich documents in early-stage design. Departments, spaces, areas, counts, efficiencies, storey assignments, target versus achieved, net versus gross. On a complex project, this can mean hundreds of rows across multiple categories.
The problem is that most of this data lives in a table. Tables are good for editing individual values. They're not good for answering questions like: which department is taking up the most area? How does the space count distribute across floors? Is the program balanced, or is one department oversized relative to the rest?
To answer those questions visually, most teams do the same thing. They export the program to Excel. They build a chart manually. They format it. They paste it into a slide deck or an InDesign layout. If the program changes (and it always changes), they do it again.
This is one of the reasons we built Snaptrude as a connected platform: too much of an architect's time goes to moving data between tools instead of working with the data itself.
If you run a firm, you've seen this play out. Someone spends 30 minutes building a chart for a client presentation, then the program changes the next day and the chart is out of date. The data was always there. The visualization just wasn't connected to it.
Key Takeaway: Program data is rich but hard to read in table form. Most teams still export to Excel to build charts, which breaks the connection between the data and the visualization.
What if charts came from the data that's already there?
We asked a specific question: what if an architect could type "show me the area breakdown by department" and get a chart back in seconds, built from the actual program data in the project?
That's what the Chart Agent does. It's one of the AI agents we introduced with Snaptrude AI, and it works inside Program Mode.

You select Chart from the agent dropdown, type a prompt describing what you want to visualize, and the agent does two things. First, it analyzes your program data and prepares the right dataset for the chart. Then it generates the chart in a new sheet inside Snaptrude.
The chart reads your actual data. If your program has 11 departments and 176,000 sqft of total area, the chart shows exactly that. If you update the program, you can regenerate the chart and it reflects the current state.
You don't need to know which chart type to use. You can ask for one specifically ("create a bar chart of area by department") or describe what you want to see ("show me how space counts distribute across the program") and the agent picks the appropriate format.
Key Takeaway: The Chart Agent reads your actual program data and generates charts from a single prompt. No exporting, no manual data prep, no formatting.
What data can the Chart Agent work with?
The agent isn't limited to the main program table. It can read and visualize data from multiple sources in your project.
Program data. Departments, spaces, areas, counts, efficiencies. This is the most common use. You ask "plot total area for each department" and it reads the program and generates the chart.
Custom sheets. If you've added custom columns or sheets to your project (phasing data, cost estimates, sustainability metrics), the agent can chart those too. It reads the column headers and data values, so you can ask for visualizations across any dimension your project tracks.
Imported data. If you've imported an Excel file into Snaptrude, the agent can read and visualize that data. This is useful when you have external benchmarks, client requirements, or historical project data that you want to compare against your current program.
Selected data. You can highlight specific rows or sections of your program before prompting the agent. It gives higher priority to selected data, so you can focus the visualization on exactly the subset you care about.
This flexibility matters because real projects don't live in a single table. A hospital program might have department areas in the main sheet, phasing data in a custom column, and benchmark data from a similar project imported as an Excel file. The Chart Agent can work across all of it.
Key Takeaway: The agent reads program data, custom sheets, imported files, and selected data. You can visualize any dimension your project tracks.
How does this fit into how architects actually present data?
Charts in architecture aren't decorative. They serve a specific function: helping people make decisions.
When a principal reviews a program with a client, area distribution charts show whether the program is balanced. When a project manager checks feasibility, FAR utilization charts show how much of the buildable area is being used. When a team presents to a developer, space count breakdowns show the unit mix at a glance.
The problem has never been that architects don't need charts. It's that making them takes too long relative to how quickly the underlying data changes. By the time the chart is formatted and placed in a presentation, the program has already moved on.
Because the Chart Agent lives inside Snaptrude 3.0's connected workflow, the charts stay close to the data. You generate them in Program Mode, and they live in a sheet you can reference from Present Mode. If the program changes, you regenerate the chart. The loop between data and visualization stays tight.
If you've been using Snaptrude's real-time feasibility tools to track areas and FAR in real time, the Chart Agent is the visual layer on top of that. The numbers were already live. Now you can see them.
Key Takeaway: Charts help teams make decisions, but they go stale as soon as the program changes. The Chart Agent keeps visualizations connected to the live program data.
What doesn't the Chart Agent do?
A few things worth being direct about.
The Chart Agent generates charts from data that already exists in your project. It doesn't create data, run calculations, or pull external information. If you need building code data, that's what the Research Agent is for. If you need zoning and site data, that's the Site Analysis Agent. The Chart Agent visualizes what you already have.
Charts are generated in a new sheet. They're editable, but they're not live-linked to the program table in the way that area panel totals are. If the program changes significantly, you'll want to regenerate the chart to reflect the current state.
The agent picks reasonable chart types based on your prompt, but you can always specify what you want. If you ask for an area breakdown and get a bar chart but wanted a pie chart, just ask again with the chart type specified.
What does this mean for how teams work?
We built the Chart Agent because we kept seeing the same pattern. Teams had all the data they needed in their program. The data was structured, complete, and up to date. But turning it into something visual for a review, a presentation, or a decision meant leaving the tool and spending time on formatting.
That's wasted effort. Especially in early design, where programs change frequently and every visualization is temporary by nature.
When your team can generate a chart in seconds from a prompt, a few things change. Program reviews become more visual without extra prep time. Client presentations include current data, not last week's snapshot. And the people building the program can see the shape of it as it evolves, not just the rows and columns.
We'll follow up with a post showing specific use cases and chart types the agent handles. For now, the core idea is simple: your program already has the data. The Chart Agent lets you see it.
Related reading
- Top 18 AI Tools for Architects in 2026
- 10 Prompts That Turn Your Building Program Into Visual Answers
- When Spreadsheets Become Design Intent (and Why That Has Been the Problem All Along)
- AI Agents for Architectural Programming: What They Do and Why We Built Them
The Chart Agent is live in Snaptrude. Try it on your next project.

